


Q3 investment update 🏆 Bull(ion) market
Did you expect markets to take a summer holiday?
They often do. After all, investors like beaches too.
But not this year. Instead, European stocks posted their best year-to-date gains in 25 years1, Canadian equities struck gold, and market indexes hit new all-time highs2—all before we hung up our swim shorts.
Bonds? They mostly napped, but that’s also part of the story.
Let’s dive in, shall we?
Zoom in | Portfolio performance
Are your elbows up, Canada? Time to puff out your chest as well.
While equity markets around the world turned in a positive performance this quarter, Canadian stocks in particular continued to outmanoeuvre their U.S. and European counterparts3, powered by banks (hi there!) and a glittering surge in gold prices.
The upshot? All Tangerine Portfolios gained in Q3.
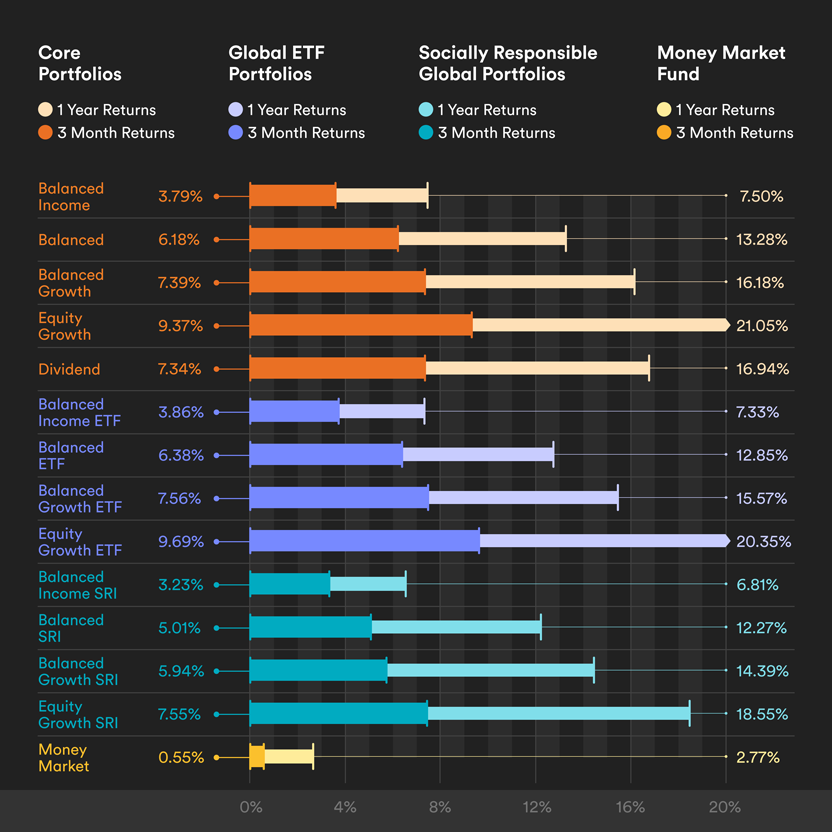
Portfolio performance as at Sept. 30, 2025. Source: 1832 Asset Management L.P. Past returns are not indicative of future performance.
Zoom in closer ⭐️ Canada wins gold
Economic uncertainty, inflation worries and U.S. dollar weakness all sound like bad news. But that can mean good news for the price of gold, which has reached an all-time high, as investors flock to the traditional “safe haven” of the yellow metal.
And how did Canada benefit? Gold-mining companies now make up more than half of the TSX’s top performing 30 companies, and were a major driver of gains in Q3.
Not bad, considering all the gold in the world could fit inside a 23-metre cube.
Investor insight 🇨🇦 Exchange freight 🇺🇸
The U.S. market grew this quarter—but just how much depends on the currency.
If you look at the performance of the stock index in U.S. dollars, returns have been a solid 14.83% on the year (as at Sept. 30).
But when Canadian investors buy U.S. equities, we need to convert them to Canadian dollars, and then convert those loonies back to greenbacks when we sell.
So what happens when you look at those U.S. returns in our own currency? They drop to just 11.1%, as though Canada is slapping an invisible tariff on American stocks. That’s because the value of the U.S. dollar has declined relative to our own over the same period—as it has against all major currencies this year.
Compare that number to Canada’s S&P/TSX Composite Index, with a return (as of Sept. 30) of 23.93%!
Note that for the first three quarters this year, it’s Canada 3, USA 0. But who’s keeping score?
Zoom out | Bonds and rebounds
Remember April’s selloff? Fear of recession sent markets tumbling—but the rebound in the S&P 500 has been the fastest in more than 50 years that did not follow a recession. As of Sept. 30, the index has bounced back a resounding 31.6%.
Year |
Size of rebound |
1974* |
37.2% |
1982* |
37.9% |
1998 |
27.4% |
2009* |
29.2% |
2020* |
37.0% |
2025 |
31.6% |
Table showing the size of major rebounds in the S&P 500 PR index 175 days after a market correction since 1974, in Canadian currency. * denotes rebounds that came after a recession within the previous year. Source: Morningstar.
So, smarty-pants, what’s your point? You might ask.
We’ve said it before, and we may say it in every one of these updates, because it’s just that important: when the waters get rough, don’t bail.
Getting out of the market when it’s down, or even moving to a more conservative portfolio, can mean selling your equities when prices are low – the opposite of “buy low, sell high.” This can have significant negative impact on your returns. If you had sold your investments after equities dropped in April, then you would have missed one of the strongest market recoveries ever recorded. That’s when FOMO, the fear of missing out, turns to COMO, the cost of missing out.
The Big Question
With Mike Allen, Head of Advice at Tangerine Investments
Q: Bonds were down in value earlier this quarter. Should I stop including them in my Portfolio?
A: Depends. Do you like to live dangerously?
Fixed income can lose its value from time to time, but good quality bonds are considered a low-risk component of any investment Portfolio. Even when prices go down, you can still count on regular interest payments and the return of your principal at maturity.
More importantly, bonds can act as an anchor in your portfolio when equity markets are down, like they were back in April. That’s because when stocks fall, bonds tend to rise in value, as more investors flock to them for safety.
💌 Ask Mike a Big (or small) Question
The short of it
We learned a few things this quarter. Let’s sum up:
- April’s rebound moved faster than World Cup presale tickets—and higher too. 🤯
- Gold prices helped drive Canada’s markets to glittering highs. 🤑
- Equities and bonds move differently, which is why they can look so good together. 😍
Remember, Clients can always reach out to a Tangerine Advisor to discuss your investments, at 1-877-464-5678.
Catch you next quarter 👀

Ready to start investing?
We’ve got simple options that keep your money working for you in the short and long term.
1 YTD Sept. 30 from 2000 to 2025. This applies to both Europe and EAFE (MSCI Europe NR Index and MSCI EAFE NR Index) in CAD. Source: Morningstar Direct.
2 The S&P 500 and the S&P/TSX Composite indexes hit an all-time high on Sept. 30. Source: S&P Global.
3 From July 1 to Sept. 30, the S&P 500 TR Index returned 10.26%, the S&P/TSX Composite TR Index 12.50% and the MSCI Europe NR Index returned 5.66%. All returns in CAD. Source: Morningstar Direct.
Note: The indicated rates of return are the historical annual compounded total returns including changes in unit value and reinvestment of all distributions and do not take into account sales, redemption, distribution or optional charges or income taxes payable by any security holder that would have reduced returns.